What is an Anomaly?
In an earlier post, we took a look at the exquisite magic that is data anomaly detection. Today, we focus on the underlying question, "What is an anomaly?"
In common parlance, the definition of anomaly is "something different, abnormal, peculiar, or not easily classified." Something is anomalous when it is "inconsistent with or deviating from what is usual, normal, or expected." Anomalies are the antithesis of normal, the opposite of routine, run of the mill, business as usual, they are an abnormality..
Data scientists long have discussed anomalies and their detection. In a Computer Networks article from 2007, for example, the authors wrote that "anomaly detection systems compare activities against a 'normal' baseline." The authors of a 2013 paper published in the Journal of Artificial Intelligence Research offered a similar definition: "Anomaly detection deals with identifying unlikely and rare events."
When it comes to eDiscovery, anomalies have been mentioned in various contexts. A 2016 McGuireWoods E-Discovery Update noted that hit reports "sometimes identify anomalies that can be researched further by looking at sample documents". Crowell & Moring senior counsel John Davis, in article from 2019, remarked:
AI systems can also search for anomalies—"irregular occurrences or omissions, things that are or are not there, contrary to expectations,” says Davis. “People are now more guarded about how they communicate in emails. They may avoid emailing about a sensitive subject or use a different terminology or channel. These analytics help you look for out-of-character communications, code language, or patterns that point toward underlying meaning. For example, if someone who is usually chatty in texts suddenly sends one saying, ‘Just call me on my cell,’ the system can flag that.” It can also find suspicious gaps in communication frequency that can raise red flags for further inquiry or signal failures of production or destruction of evidence.
In a post earlier this year, Sarah Moran of Lighthouse commented:
[If] a litigation involves an employee accused of stealing company information, advanced AI technology can analyze all the employee’s communications and digital activities and identify any anomalies, such as an activity that occurred during abnormal work hours or communications with other employees with whom they normally would not have reason to interact.
Why Anomalies Matter
For lawsuits and investigations, anomalies matter because they are powerful pieces of information that attorneys and investigators can use to accomplish one of their key tasks: figuring out what actually happened and why.
I came to appreciate the importance of searching for, and making effective use of, anomalous information in a case I worked on for much of the 1990s and which I discussed in The Exquisite eDiscovery Magic of Data Anomaly Detection
The significance of anomalies was explained to me by one of our expert witnesses, an econometrician. Anomalies - outliers, as he referred to them - can highlight where a story that someone constructed does not match the available facts. The story might be a description of what happened, an explanation of how something happened, or an indication of why someone did something. The someone might be you, but it could be someone else such as your client, a fact or expert witness, or opposing counsel. The facts come from the data available to you, which these days largely means ESI, but they also can be "facts" that you imagine might be correct and that you assume to be true for purposes of your exercise.
Starting with either the facts (the data) or the story, you create a map. That map can take many forms; you are limited only by your own ingenuity. If you create a map from your facts, you can test it against your story. If build a map from your story, then you test against the facts. In both situations you are looking for the discrepancies – the anomalies.
For the matter we were working on, using an elaborate, time-consuming, and expensive manual process, we mapped out the other side's story in a two-dimensional graph, ending up with something that looked much like a rough bell curve. Along the curve, especially closer to the outside edges of the curve, were spikes. Those spikes were the outliers, the data points that did not fit closely to the curve.
When we found a spike, we drilled in until we got to specific data points. In this matter, the other side used our client's product as a component part. They alleged that our client's component part failed to perform its essential purpose. By drilling in, we were able to determine that many of the claimed failures had other causes such as not even using our client's part or using it in ways that meant that it could not function properly.
The upshot was that, by looking for and examining anomalies, we were able to construct a different story of the case where the story and the facts were in much tighter alignment.
With today's technology, you no longer need to go through the painful exercise we engaged in. Today's technology can help identify anomalies and highlight them for you
Where to Find Anomalies
Examples of anomalies potentially can be found in any type of data assessed by eDiscovery platforms. They are identified through various mechanisms, such as anomaly detection algorithms. Reveal AI, for example, can identify unusual behavior based on criteria such as:
-
- Data Range
- Sender or receiver of a communication
- Concepts expressed in a document or communication
- Tone used by an author
- Named entities discussed
- Domains used
- Frequency of occurrences of specific information within a designated timeframe
What Working with Anomalies Looks Like
Reveal's platform is replete with examples showing how you can use anomalies. When ESI is loaded into the platform, various tools process the data in ways that give you the ability to look for anomalous information. Using natural language processing, unsupervised and supervised machine learning, and a host of additional tools, Reveal's platform develops baselines of behaviors and actions. It then enables you to look for deviations from those baselines.
Here are three examples:
Brainspace Anomaly Detection Heatmap
Brainspace contains an Analytics Dashboard that is packed with information such as a timeline chart; panes showing top terms; and a bar graph that displays the relative volume of original documents, near-duplicate documents, exact-duplicate documents, and documents that have not been analyzed in a dataset.
Another part of the Analytics Dashboard is the Anomaly Detection Heatmap.

The Anomaly Detection Heatmap displays the frequency of terms from your dataset, showing them over time. Anomaly detection uses a standard score to determine when a term's frequency is higher than average. Brighter colors indicate higher-than-average usage.
Key elements of the heatmap are
1. By default, the top five terms from a search are displayed.
2. If you prefer, you can select "Top Terms" to create and manage custom top-term lists.
3. You can select "Show More" to have up to ten terms displayed in the Heatmap.
4. You can view a term's frequency for a node in the Heatmap. (A node is, for example, an email address, a domain, or a collection of email addresses belonging to the same person.) You also can view documents associated with a node in the dashboard.
5. You can switch from the "Anomaly Detection" view to the "Document Volume" view.
6. You can choose "Select Multiple" to add multiple terms to a search.
7. You can select "Always Update on Search" to have the Heatmap automatically update after you perform a search.
Reveal AI Baseball Cards
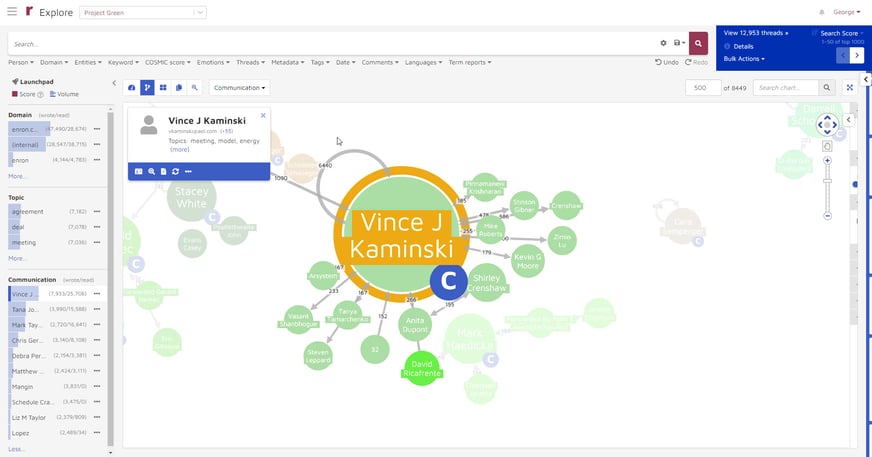
Reveal's baseball card shows profiles of entities. In this example, I selected "Vince J Kaminski" from the Communications facet. When I did that, his baseball card was displayed in the upper left of the screen.

When I click on the ![]() icon at the bottom of the baseball card, that opens the activity page for Kaminski.
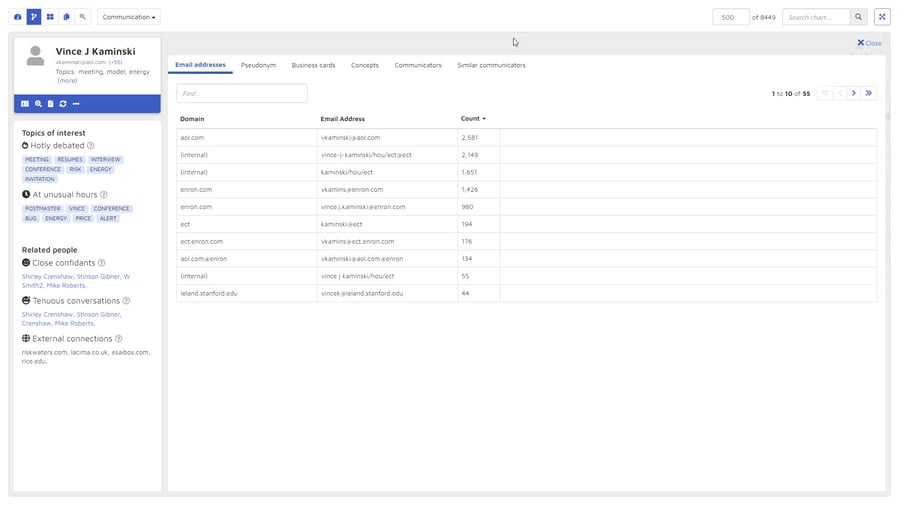
icon at the bottom of the baseball card, that opens the activity page for Kaminski.
 This page shows several types of anomalous information that might be useful. On the left, it displays two types of topics of interest. It shows the top seven hotly debated topics from Kaminski's documents. These are topics whose content exhibits medium or high negative sentiment, sorted by sentiment score in negative order. It also shows the top seven topics discussed at unusual hours - after business hours or during weekends.
Below that, the activity page shows information about three categories of related people. It lists the top five close confidants, who are the people with whom Kaminski communicated most frequently. It shows the top four people with whom Kaminski had tenuous communications, where the content of the communications indicated high pressure. It lists the top four external communications, external domains which with Kaminski communicated.
On the right side of the activity page are displayed six categories of information: email addresses, pseudonyms, business cards, concepts, communicators, and similar communicators. While it would be a stretch to characterize the content these categories as anomalous, the information presented helps you quickly get a fuller understand of the person whose activity page you are looking at.
Reveal AI Cards
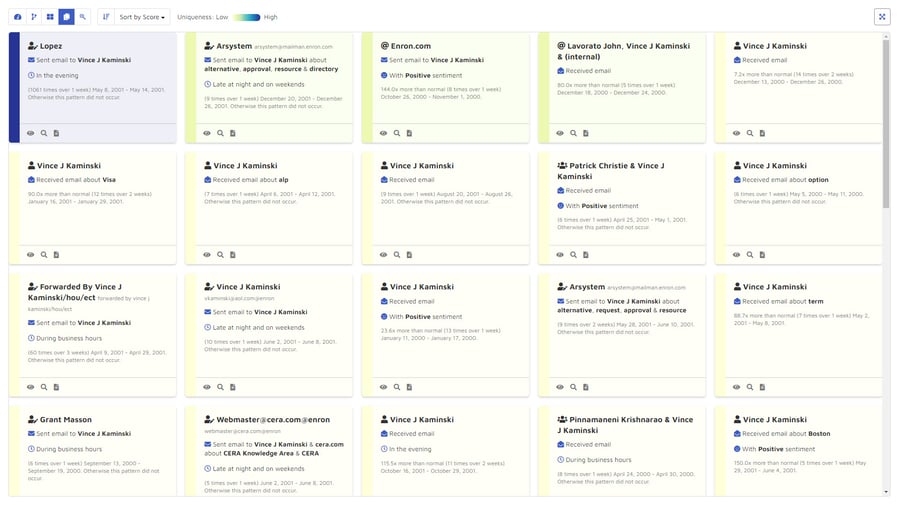
Another way of looking at anomalous information is with Reveal AI Cards. Cards represent anomalous patterns found in a user's data. Cards are packed full of outlier information, allowing you to hone in on the spikes I discussed above.

Each card is given a uniqueness score. By default, the cards are sorted from most unique to least. Cards with very high uniqueness scores are displayed in blue, those with moderately unique scores in green, and those with common uniqueness scores in yellow.
Cards can be searched or sorted to identify patterns of communication that took place outside regular business hours. The blue card is about email sent by Lopez to Kaminski in the evening. The card to its right shows communications that look place late at night and on weekends.
Cards can highlight unusually large numbers of communications in a short period of time that would be considered an oddity. The same blue card shows that Lopez emailed Kaminski 1,061 times in a one-week period, and pattern that did not occur elsewhere in the data.
Cards shows expressions of sentiment. Three of the cards, for example, are about communications with positive sentiment.
The Power of Anomalies
By identifying anomalous information early on, you can quickly begin to build a picture - really a set of pictures - of what seems to have happened in the matter. You can begin to get a sense of who was involved, what they talked about, when and how they talked about it, and at what time. With the right data, you even can start to get at the why of the matter.
By returning to anomalous data throughout the life of your matter, you can continue to refine that story of the case, and by doing so better position yourself to bring that matter to a satisfactory conclusion.

