


In lawsuits and investigations, time is of the essence. When we work on such matters, we rarely have enough time to do all we feel needs to be done, we constantly are working against the clock, and to this many of us charge by the hour, often in six-minute increments, as we go.
Time is of the essence in another way.
Dates and times are critically important in lawsuits and investigations. At the beginning of a new matter, we deal with asserted times. The parties entered into a contract on this date. The plaintiff slipped and fell at this hour. The defendant knew about the alleged product defect on this day and yet did not take any action to address the defect until another date much later on.
As early as we are able to in a new matter, we gather and start evaluating data. As we begin examining that data, we will want to look for gaps. In the data we have so far, for example, are there large numbers of communications between two key people before and after a critical period of time but almost none between those two people during that period?
As we begin to work with the data we have gathered, we also will want to compare dates in documents – such as the complaint or answer in a lawsuit or a civil investigative demand issued by the Department of Justice – with dates in the data we have. We look for inconsistencies, inaccurate dates in the documents, gaps, and the more.
At some point, we will need to develop chronologies of events. We might want to put together an overall chronology. We might want to prepare a chronology for a specific witness. We might want to assemble the chronology of the development of a new drug. The better we can work with dates, the easier it will be to put together those chronologies.
With Reveal 11, we give you a wide array of ways to search for and work with dates and times. Some of these approaches will be familiar to anyone who has worked with an eDiscovery review platform. Others may be new to you. Here are a few.
From the Dashboard
The Dashboard is the first screen you see when you open a project in Reveal 11. It is your control center; project data, visualizations, filters, searches, and analytical tools all are available on this screen. From here you can organize, select, search, and manage documents.
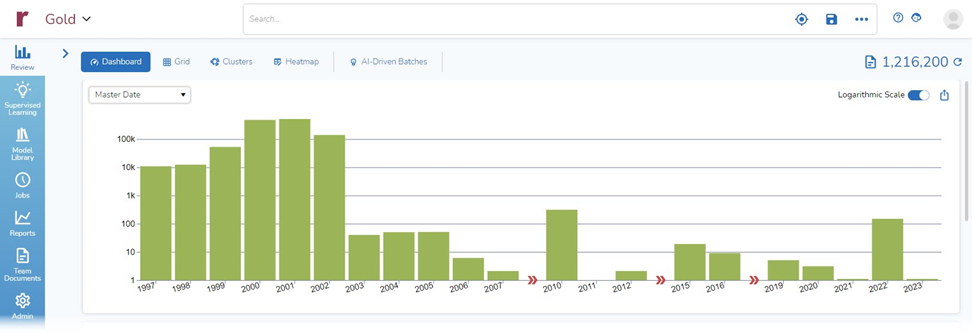
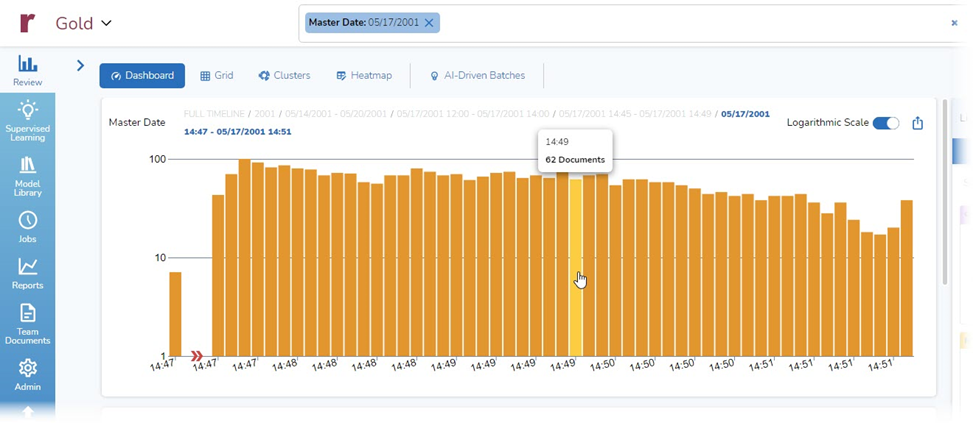
Near the top of the screen is the Timeline, a clickable bar graph for viewing dates and times of data from a selected period of time:
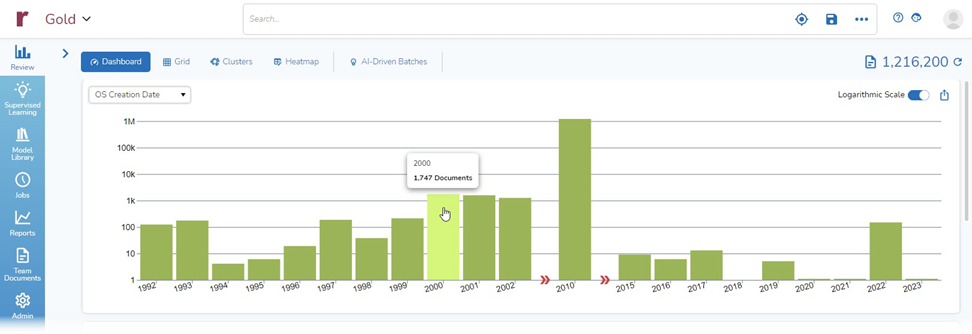
The Timeline gives a visual depiction of document counts for a set period of time. Because we have not yet searched or filtered the documents, the chart shows information for all 1,216,200 documents in the dataset that I am using.
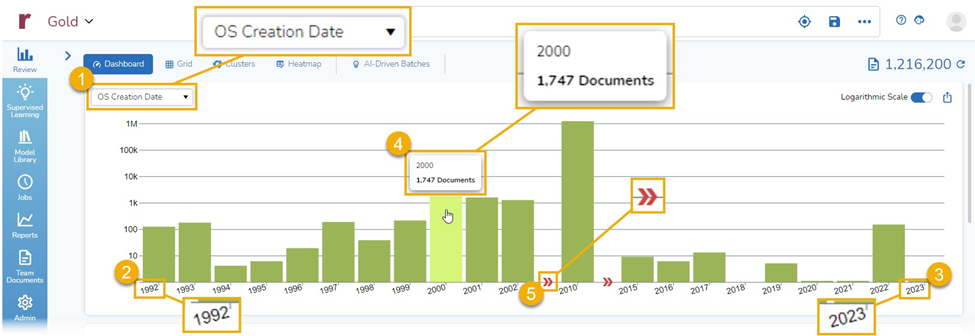
Among other things, the Timeline shows:
- The type of data values used, OS Creation Date in this example;
- The year for the oldest documents, 1992, because initially the Timeline shows documents by year;
- The year for the most recent documents;
- The number of documents in a year, if you move the cursor over the column; and
- Gaps in the Timeline, times for which there are no documents.
Selecting Date Value Type for Timeline
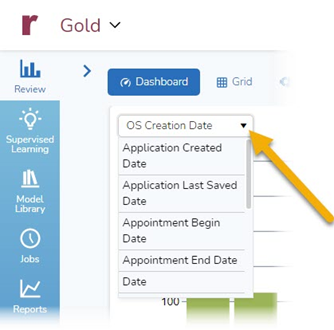
The Timeline can use any date value contained in document metadata. By default, the example above is using OS Creation Date. I can change the date value type by clicking on the down arrow to the right of the date type and selecting a different option from the list presented to me:
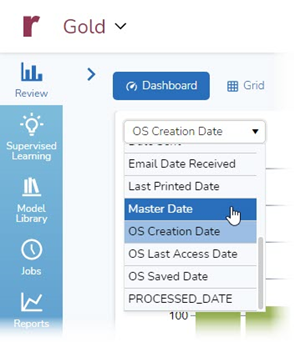
Here, I changed the date value type to Master Date. I could easily have chosen another type, such as Date Sent, Date Received, Last Printed Date, Appointment Begin Date, and so on:
With a different date value selected, the chart now looks quite different:
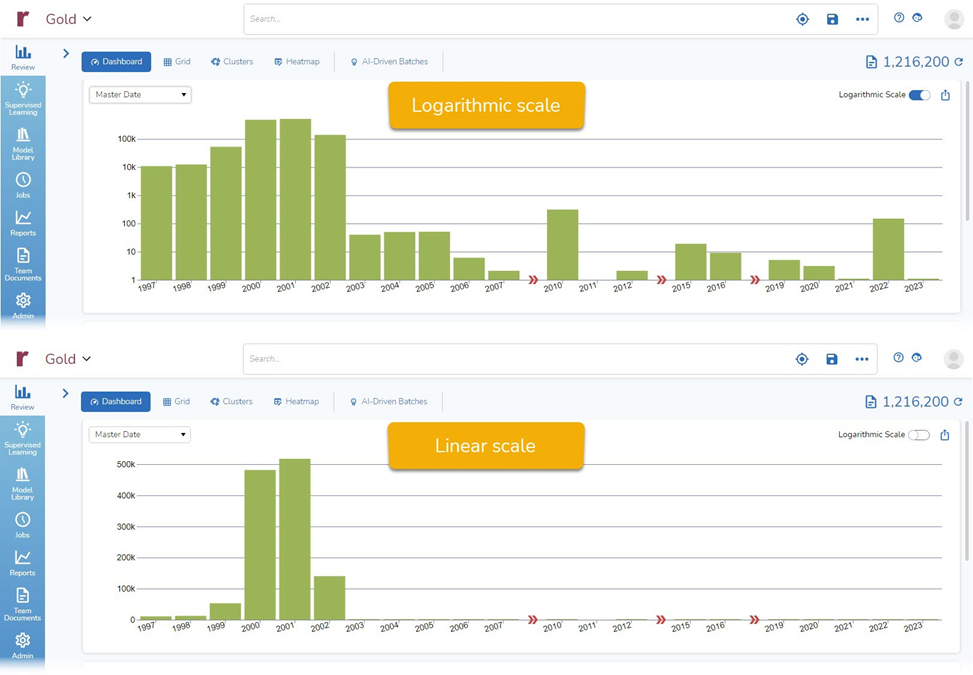
Choose Logarithmic versus Linear Scale Timeline
By default, the Timeline uses a logarithmic scale. This makes it easier to compare bars where there is a great difference in the totals. If you prefer, you can change to a linear scale.
Here is the same date shown in both views. With the logarithmic view, you can compare relative volumes of data across years. With the linear view, there are so many more documents in the years 2000 and 2001 that the bars for many of the other years are barely visible:
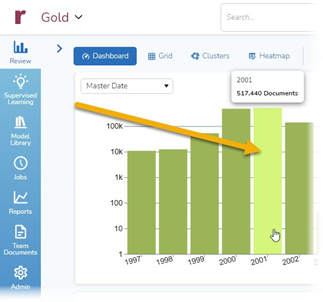
Drill Down for a More Granular Timeline
You can use the Timeline to drill down for greater detail. By default, the timeline initially shows dates by year. You can click on the bar for a specific year, such as 2001, to drill down:
When I do this, I get back a Timeline showing only documents for the year 2001, with each bar representing a week of data:
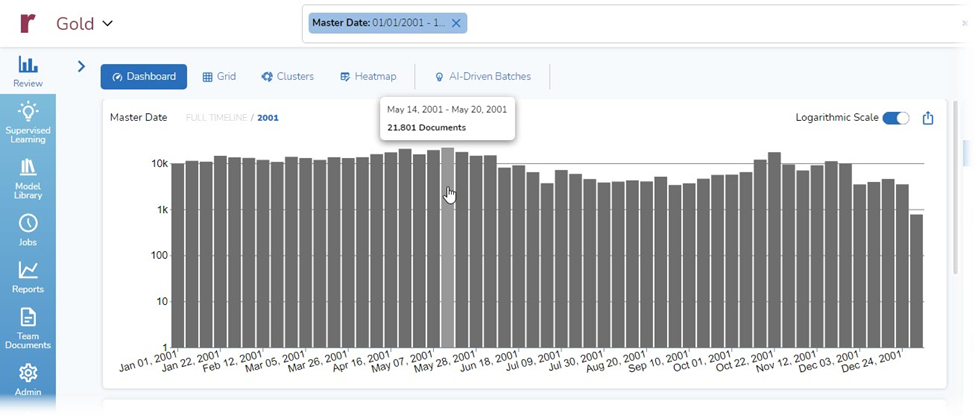
I can keep drilling down as far as the data will permit. Here, I have gone down to the second:
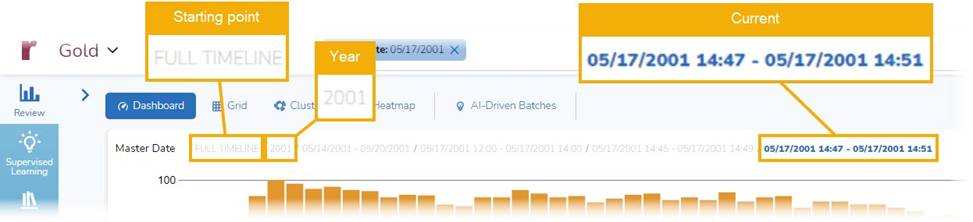
At any point, I can click on the Timeline breadcrumb to go back up, all the way to my starting point:
Search with Advanced Search
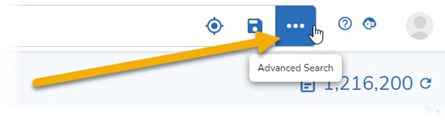
For tight granular control over search dates, you also can use Advanced Search. Advanced Search lets you add conditions, fields, and lists of terms to a search. You can access Advanced Search access by clicking on the three-button icon at farthest right in the Search bar:
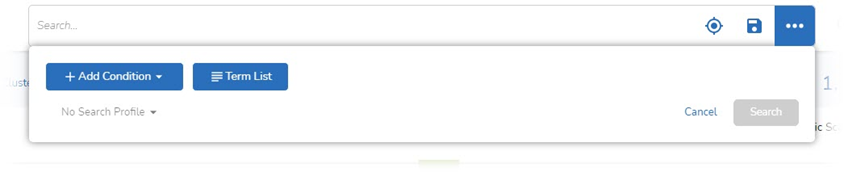
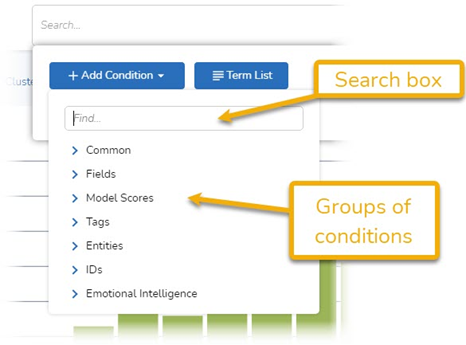
This will bring up a search pane with two options, +Add Condition and Term List:
If you select +Add Condition, you either can start typing in the search box or drill down into the options listed below the search box:
Search for a Date or Range of Dates in Advanced Search
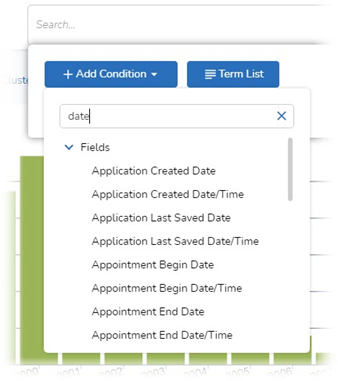
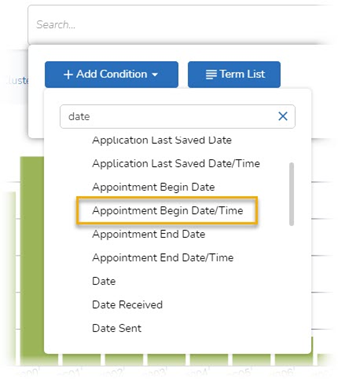
Here, I entered date in the search box. The platform returned a list of the date fields available in the database I am using. I can select any of the nearly 30 listed fields for a date search:
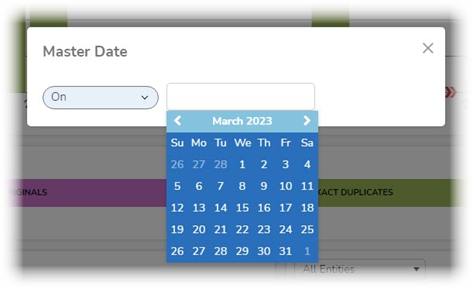
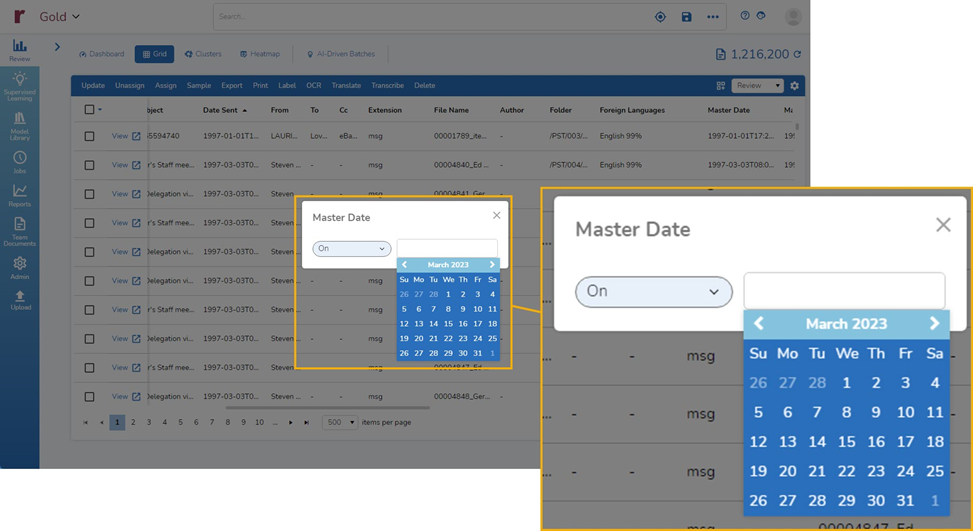
I chose Master Date from the list of date fields. When I did this, the platform presented me a form to use for selecting the date or range of dates I want to search for:
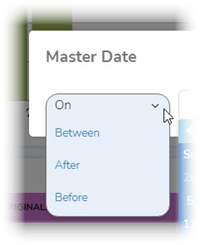
From that form, I can choose whether I want to search for documents On a specific date, Between two dates, After a specific date, or Before a specific date:
Here, I opted to chose to search for documents Between two dates. When I did this, the platform presented me with two boxes where I could enter dates and, if I prefer, a calendar option to use for the first date:
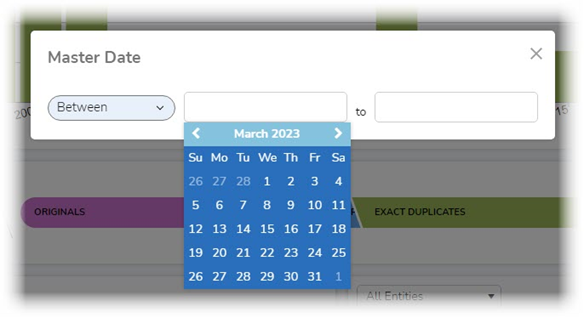
I could choose to enter dates in the date boxes. If you do that, make sure you use a full eight-digit date such as 01/01/2010:
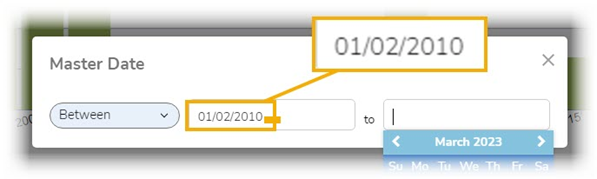
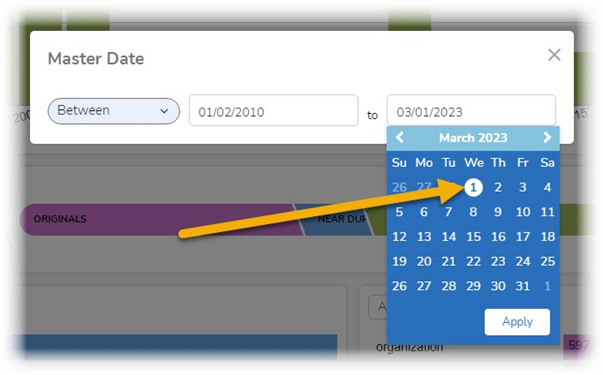
If I prefer, can pick a date from the calendar. If the date I want already is displayed, I click on it to add the date to the search box:
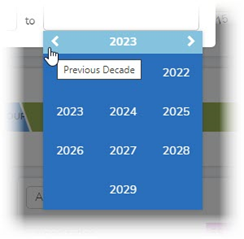
I also can use the calendar to navigate to a date. If I click on the light blue bar at the top of the calendar, the platform brings up the months for the year displayed in the bar:
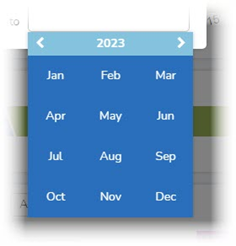
I could select one of the months displayed, or I could click on the year displayed to bring up a list of years to choose from, choose one of those years or navigate to earlier or later ones, and continue until I got to the date I wanted to use:
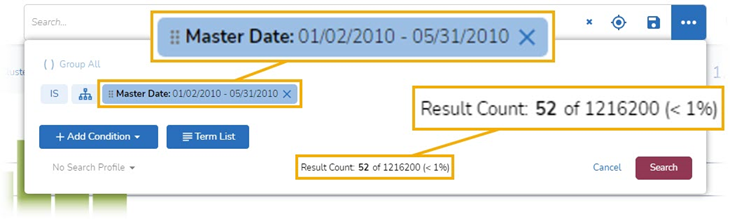
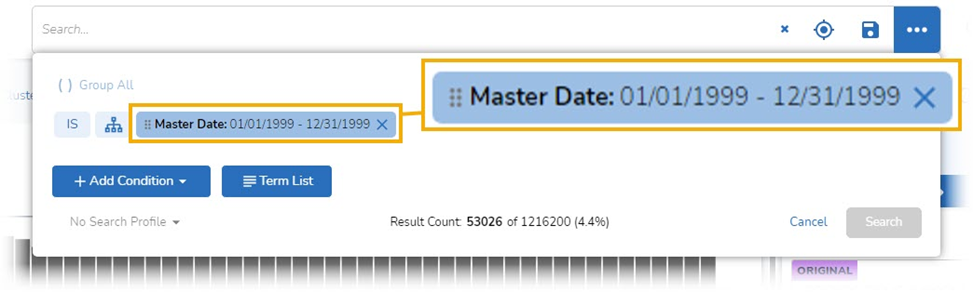
Once I select my dates, those are added to the search displayed in the Advance Search box. At the same time, the platform shows me how may documents will be found if I run the search:
Add Time to Your Advanced Search
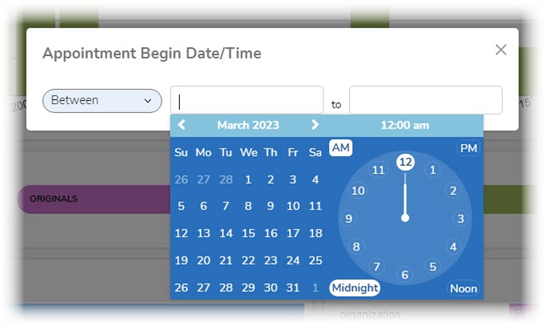
What search options you see is a function of the data you choose to search for. In the example above, I used Master Date. If I choose a field that contains time data, I get additional search options. Here, I selected Appointment Begin Date/Time:
Now, I get options for selecting times as well as dates:
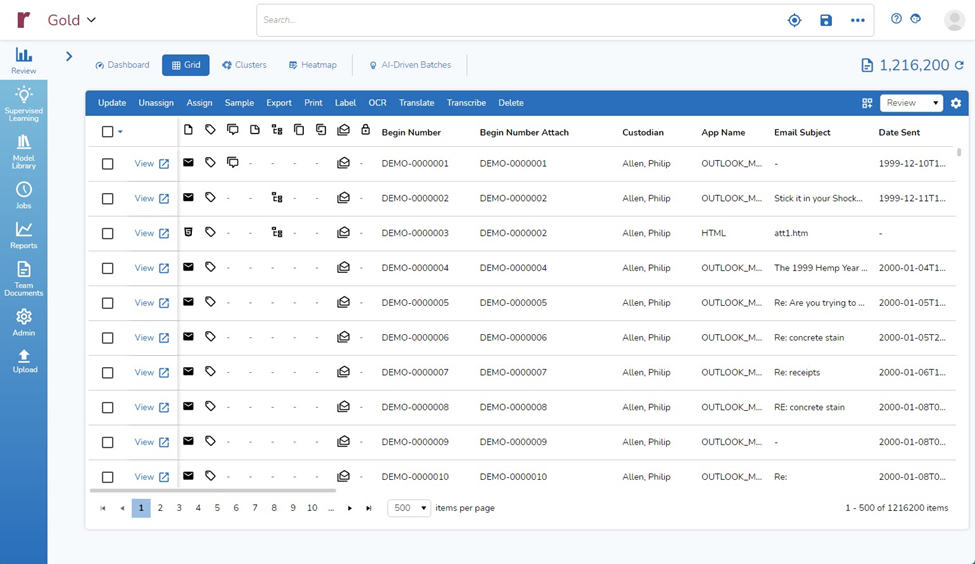
From the Grid
The Reveal Grid displays a table of currently-selected documents and their metadata. You can use this table to select, sort, and perform operations on documents displayed in the Grid. You also can choose what information to display in the grid, the order in which that information is displayed, the number of documents displayed per page, and more. Here is a typical Grid view:
In the Grid, you can search for dates (and times) used Advanced Search, as discussed above.
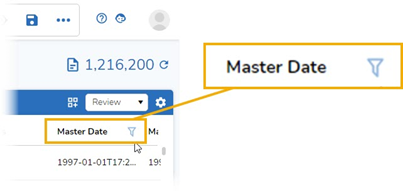
You also can filter within the grid. Here, I opted to filter on the Master Date field:
That brought up the same date search options as with Advanced Search:
Searches Apply Across Views
Once I run a search, whether for dates or any other search, the results of the search carry over from one view of data to another.
Here, I did a search for documents from January 1, 1999, to December 31, 1999:
I can see information about and analysis of 53,026 documents found by that search in four different views in the platform: Dashboard, Grid, Clusters, and Heatmap.
Dashboard View
In the Dashboard view, I can see the Timeline, discussed above. I also can see much more:
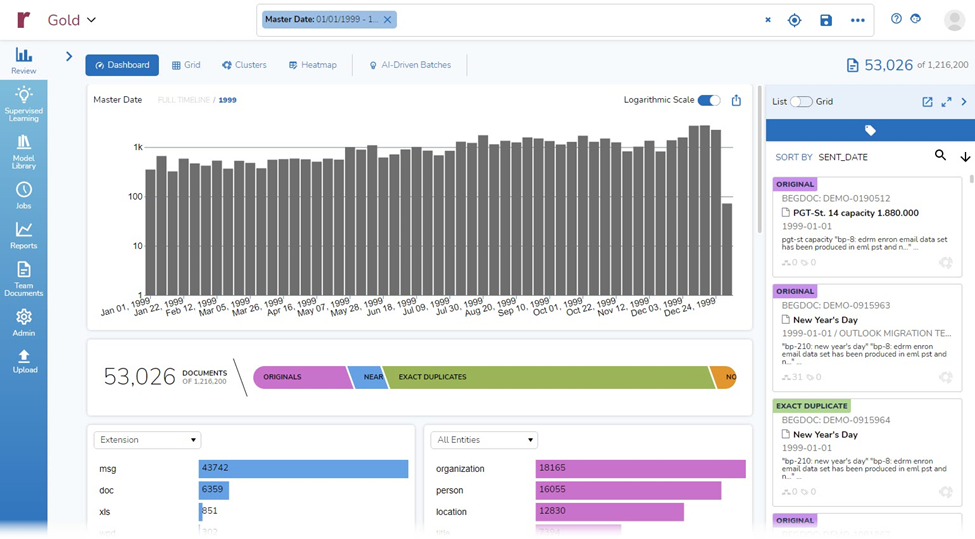
In addition to the Timeline, by default I see:
- The Candy Bar: a clickable graphic display of Originals, Near Duplicates, Exact Duplicates, and documents Not Analyzed because they are encrypted, lack text, or contain excessive text) in the current view.
- Extension: a clickable chart of documents by extension type, showing type and document count in descending order.
- All Entities: a clickable chart of entity types, showing type and document count in descending order.
- Custodian: a clickable chart of custodians, showing custodian and document count in descending order.
- Documents by Predictive Scores: a clickable chart of classifier tags used with the data and AI Models applied to the data, showing ranges of scores for each model – Unscored, Low (0-320, Medium (33-65), and High (66-100).
- Senders + Recipients: a clickable chart of communicators showing, for each communicator, counts of communications sent and received.
- Domains: a clickable chart of domains in the data, showing counts of communications to and from those domains and counts of unique documents per domain.
- Emotional Intelligence: a clickable chart of analyses done of sentiment based content in the documents – Rationalization, Opportunity, Intent, Pressure, Roundabout Style, Negativity, and Positivity – along with ranges of scores for each form of Emotional Intelligence – Unscored, Neutral (0), Low (1-3), Medium (4-6), and High (7-10).
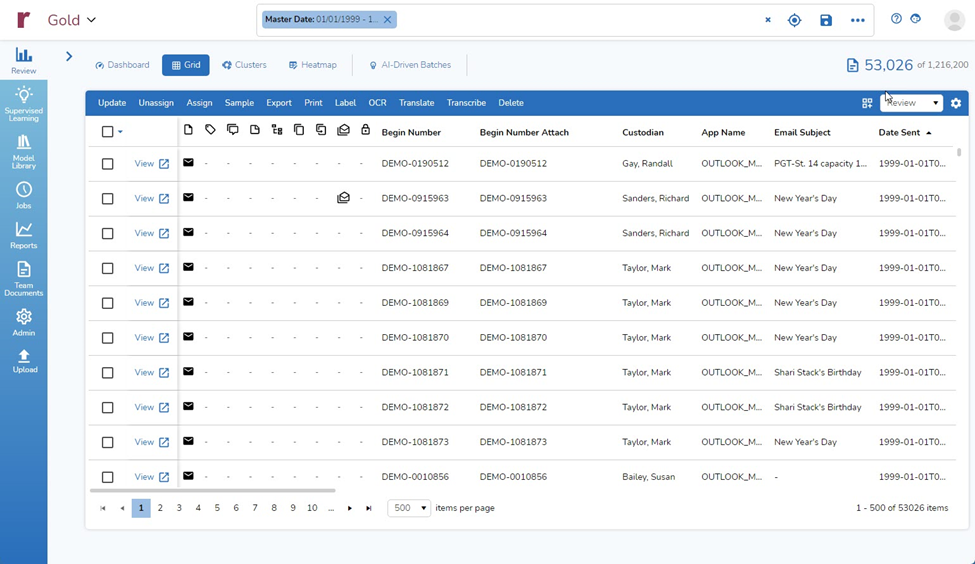
Grid View
Here are the same 53,026 documents presented in the Grid view, probably the most familiar visualization of data for most people who have worked with eDiscovery platforms:
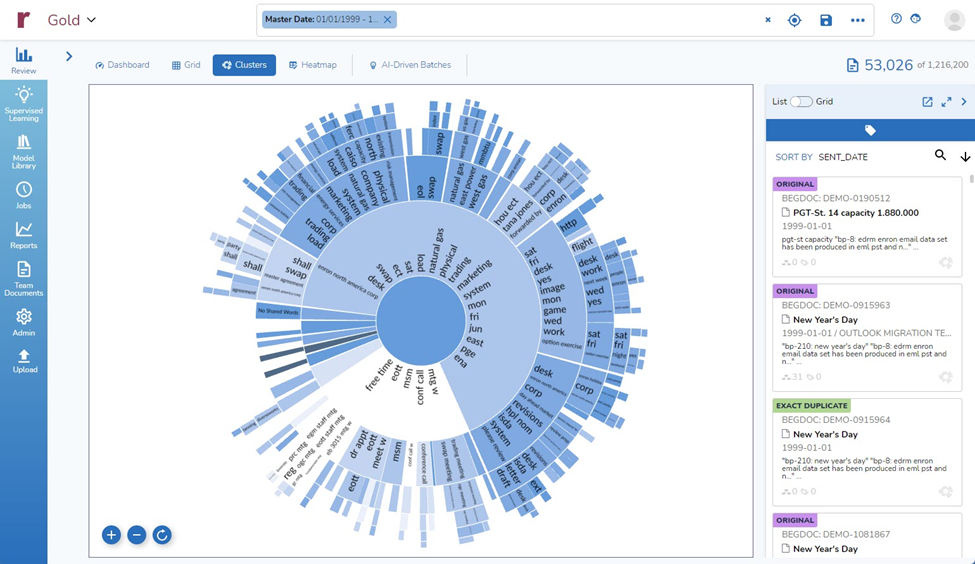
Clusters View
Reveal’s Clusters view uses Brainspace dynamic learning to cluster all documents in a dataset into an interactive data visualization based upon lexical similarity.
Each document group or Cluster includes a set of themes which describe the overall subject matter of the document group. In the Clusters view, you can navigate the clusters like a map, quickly identifying neighborhoods of related documents versus one document at a time.
Here are the same 53,026 documents seen in the Clusters view:
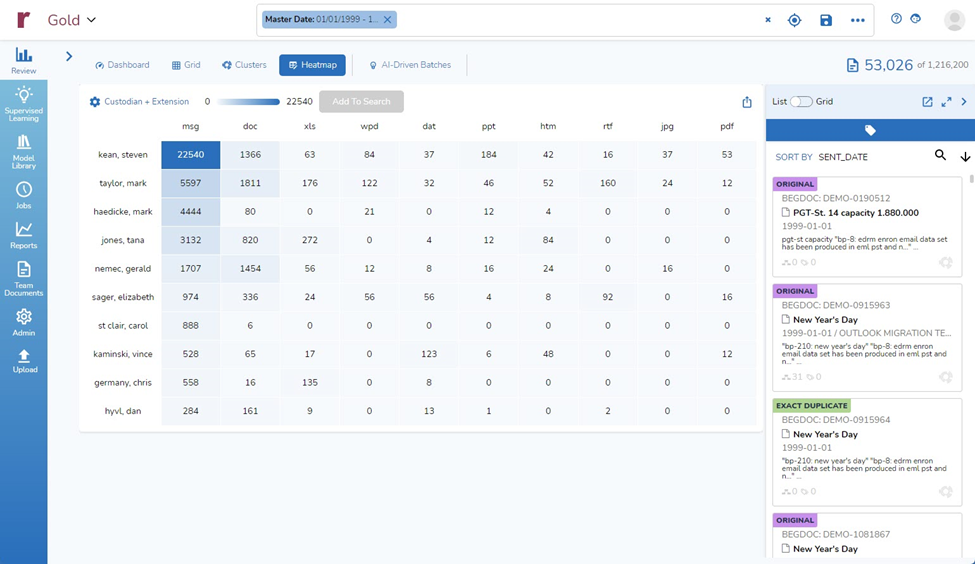
Heatmap View
The Heatmap, our newest view, is a grid showing the co-occurrence of top terms of one type of metadata with top values of a second type of metadata. The colors of the boxes in the Heatmap indicate the preponderance of intersections within the grid. By default, rows in the heatmaps show custodians and columns show document types. You can select other options for both columns and rows.
Here is that same group of 53,026 documents in the Heatmap view. You can see, for example, that for the date range selected, Steven Kean had the largest number of .msg files (22,540) and Mark Taylor had the largest number of .doc files (1,811):
And There’s More
What I showed today is just touches on how we enable you to search, display, and work with dates and times, helping you enjoy the highest quality speed to insight in the industry.
For more information about how Reveal can empower your organization, contact us for a demo.