


For this three-post series, I designed, built, and evaluated a specialized active learning classifier designed to help me find board of director meeting minutes and related documents.
The first post discussed the framework I used throughout the process of creating a classifier and the second post walked through how I designed and built that classifier.
In this post, I discuss how I evaluated and refined my classifier – and the results I got by using the classifier.
To recap, for my classifier I focused on what I hoped would be a small and manageable issue. I wanted to Enron Board of Director meeting minutes. Various keyword, concept, and other searches all had delivered overly broad results. I hoped that with an active learning classifier, I could get a better set of results.
The Results
I went through seven rounds of training with my classifier. At that point, I stepped back to evaluate the efficacy of the classifier. I used some of Reveal’s built-in capabilities to support that assessment.
As the last step for this exercise, I looked at the 30 documents with the highest responsiveness scores. All 30 documents had a score of 96 (on a scale from 0 to 100). Only two of those were documents I had tagged. Twenty-eight of the documents (93%) were documents the classifier predicted to be responsive. I reviewed all 30 documents. I, too, thought all of them were responsive.
My conclusion is that the classifier has done exactly what I hoped. After spending far less time that I would have put in with a traditional approach, I had a prioritized set of documents where ones I was looking for were at the front of the queue. This approach gave me the jump start I wanted, enabling me to formulate my written responses to the other side’s discovery requests much sooner that would otherwise have been the case, in far less time, at a lower cost to the client, and with a higher degree of reliability.
After Round Three: Evaluation and Refinement
After performing three rounds of training, I realized I needed to re-define the problem I was solving for. That meant redesigning the approach I was taking, as I discussed in the second post in this series.
Initially I had taken a narrow view of what was responsive. I tagged as nonresponsive, for example:
- Minutes of meetings of SK-Enron Co., Ltd., Enron Federal Credit Union, and other similar;
- Documents that discussed Enron board of director meetings but were not, themselves, minutes (and that did not fit into the categories I subsequently added, as noted below).
As I went along, I decided to expand my scope to include the following categories of documents as responsive. I did this because those documents seemed to contain information that informed me about actions considered or taken by the board.
With my broadened scope, I looked for:
- Minutes from meetings of the Enron board of directors;
- Notices of meetings of the board;
- Board resolutions; and
- Minutes of board committees such as the Compensation and Management Development Committee along with notices of their meetings and their resolutions.
The fourth round was a reboot for me. From that round on, I applied the broader criteria to the documents I tagged. I also went back to the documents from the earlier rounds and retagged them, again using the broader criteria.
After Round Seven
After the seventh round of tagging, I clicked on Supervised Learning, selected my Classifier, and clicked on View Details to see my progress:
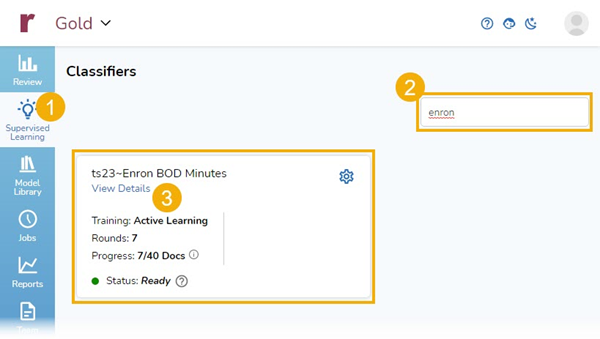
This took me to the Progress and Model Insights part of the platform. Progress contains Tagging & Scoring and Control Set. Model Insights contains Features and Document Score.
Tagging & Scoring
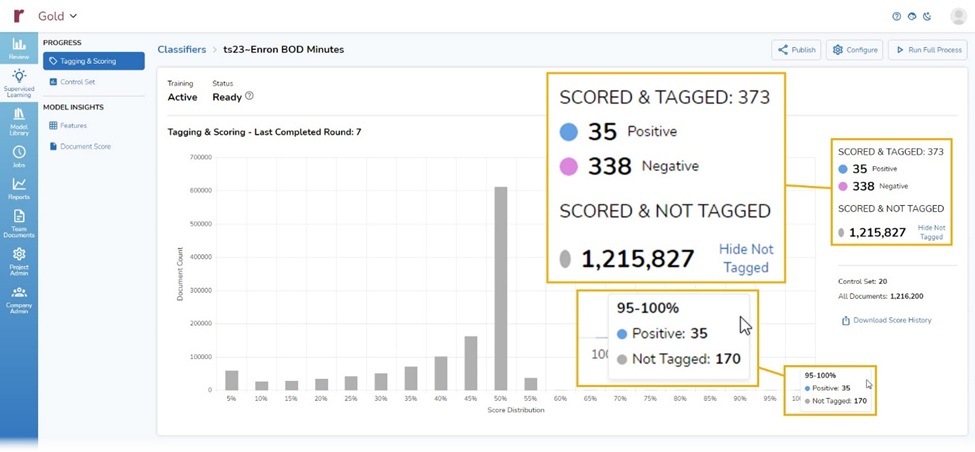
The top item in Progress, and the default starting point, is Tagging & Scoring. That section displays tagging and scoring tallies to date:
- 373 documents that I have scored and tagged,
- 35 documents I have tagged as positive,
- 338 documents I have tagged as negative, and
- 1,215,827 documents that have not yet been tagged but have been scored by the classifier.
Tagging & Scoring also shows me a chart with the distribution of scores for all documents. If I hover the cursor over a column, as I did here for the 100% column, I can see there are 205 documents in that bracket – 35 that I tagged, and an additional 170 that the classifier is 95% to 100% certain match the criteria I have indicated to it through the tagging choices I have made:
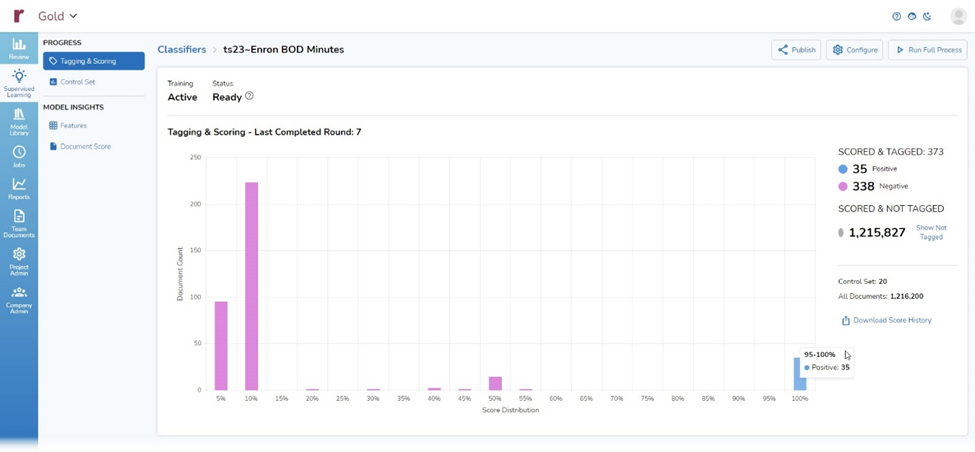
By clicking on Hide Not Tagged, I can bring up a version of the window that shows my tagging decisions while hiding information about documents not yet tagged:
Control Set
The second item under Progress is Control Set. shows Precision, Recall, F1, and Richness for the chosen round, here Round 7:
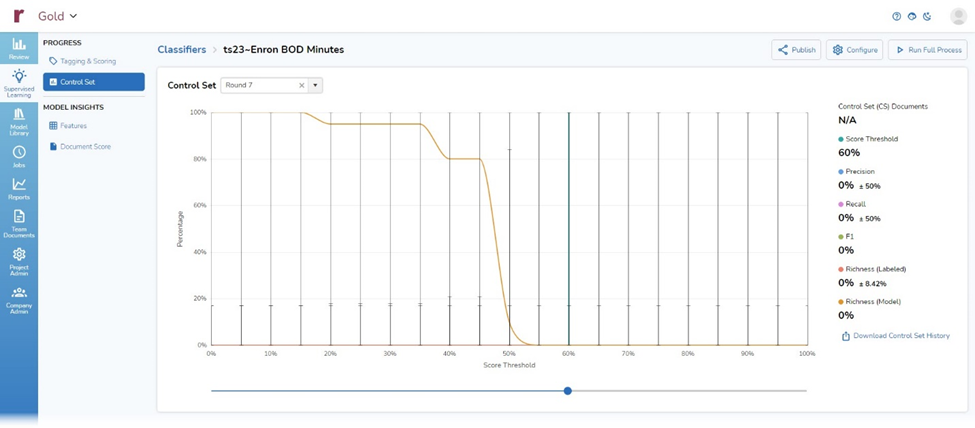
Because I still am early in the overall process, there is not yet much to see.
To better understand these terms and what this chart will shows us once enough decisions have been made, we will use the following scenario:
- We have 100 documents,
- A document is positive if it discusses penguins,
- 20 documents discuss penguins,
- 80 documents do not discuss penguins,
- Our classifier predicts that 25 documents discuss penguins.
- Of those 25, 12 discuss penguins and 13 do not.
Precision
Precision is the total number of relevant documents compared to the number of all the documents that were selected and analyzed by the classifier. Put another way, precision is the ratio of (a) documents that truly are positive to (b) documents the classifier both correctly and incorrectly predicts are positive. The formula for that is:
[Precision] = [True Positives] / ([True Predicted Positives] + [False Predicted Positives])
Or, more simply:
[Precision] = [True Positives] / [Predicted Positives]
In our example, 20 documents truly discuss penguins, the classifier correctly predicted that 12 documents discuss penguins, and the classifier incorrectly predicted that 13 documents discuss penguins.
Our precision calculation looks like this:
[Precision] = [20 documents discuss penguins] / ([12 documents the classifier thinks discuss penguins and that do discuss penguins] + [13 documents the classifier thinks discuss penguins but that do not discuss penguins])
[Precision] = 20/(12+13)
[Precision] = 4/25
[Precision] = 0.8
[Precision] = 80%
Recall
Recall asks whether I got all the documents I wanted. It is the ratio of documents the classifier correctly predicts to be positive, to documents that are positive:
[Recall] = [Correctly Predicted as Positive] / [True Positives]
In our example, our classifier correctly predicted that 12 documents discuss penguins, and 20 documents truly discuss penguins.
Our recall calculation looks like this:
[Recall] = 12/30
[Recall] = 0.6
[Recall] = 60%
F1
F1 is geometric mean (middle or balance) between precision and recall, designed to give a single number. The formula is:
[F1] = (2 x (Precision x Recall)) / (Precision + Recall)
With our example, that looks like:
[F1] = (2 x (0.8 x 0.6) / (0.8 + 0.6)
[F1] = (2 x 0.48) / 1.4
[F1] = 0.96 / 1.4
[F1] = 0.69
Richness
Richness is the percentage of truly responsive documents existing within an entire document population.
The formula is:
[Richness] = [True Positives] / [All Documents]
In our example, there are 20 documents that discuss penguins in a total population of 100 documents, so the formula looks like this:
[Richness] = 20 / 100
[Richness] = 0.2
[Richness] = 20%
Features
The first item under Model Insights is Features. This area shows keywords, entities, and other values that have contributed to my classifier. For each feature, the page displays the feature’s name, its type, and the weight assigned to that feature in the classifier.
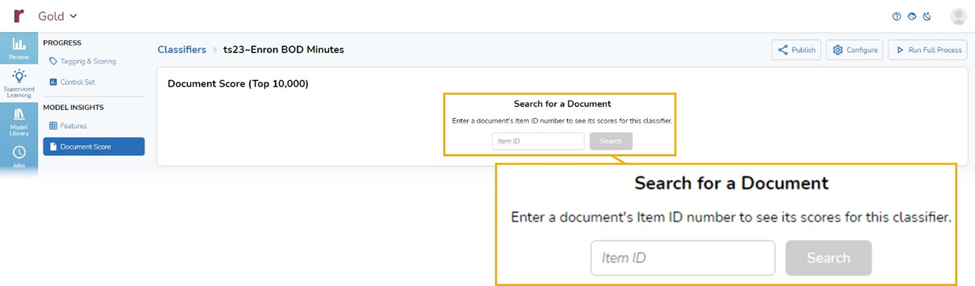
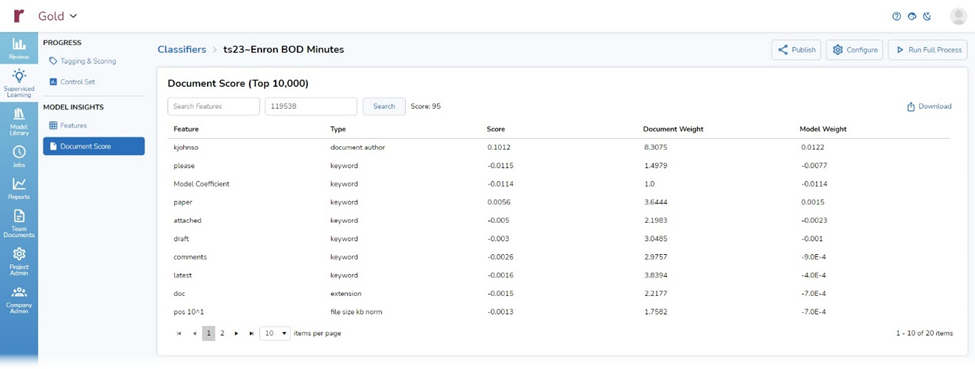
Document Score
In Document Score, the second section under Model Insights, I can enter the Item ID for a document and see the scores for that document.
Progress After Round Seven
To see how well my classifier was doing after seven rounds of training, I did one last test. I performed a search to find the highest scoring documents. For the search, I did the following:
- From Advanced Search, I selected +Add, then Model Scores, and then Reveal AI Score – BOD Minutes:
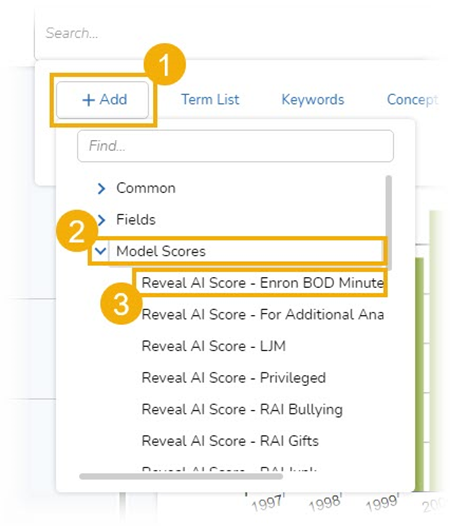
- Set the scale in the modal to find documents with scores from 90 to 100 and selected Add To Search:
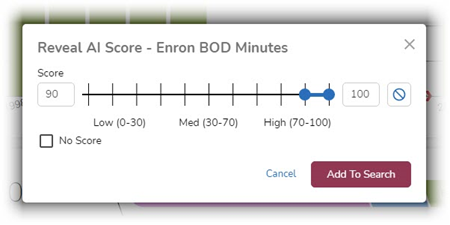
- Executed the search by clicking on Search:
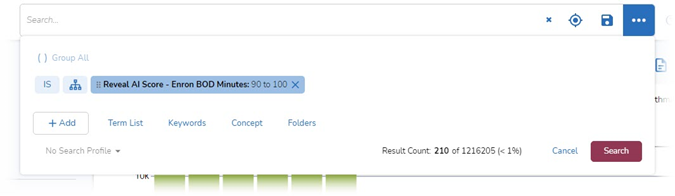
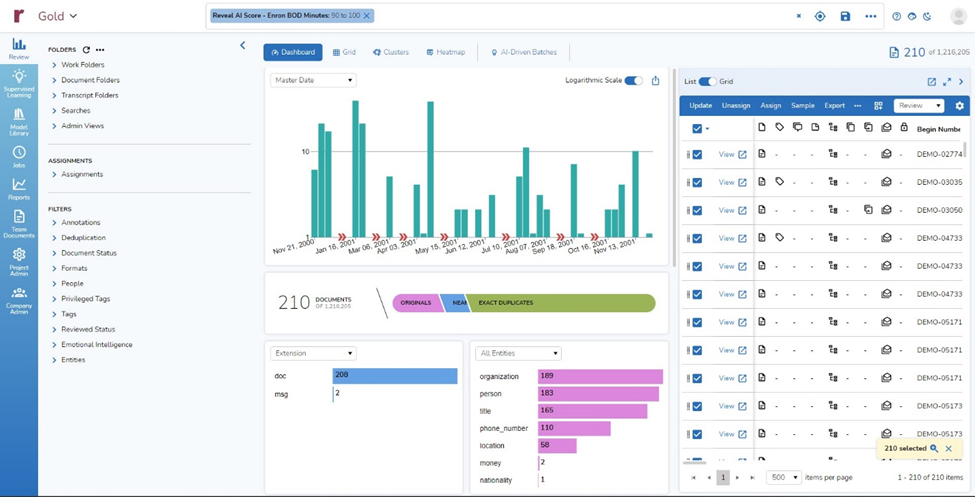
I got back 210 documents:
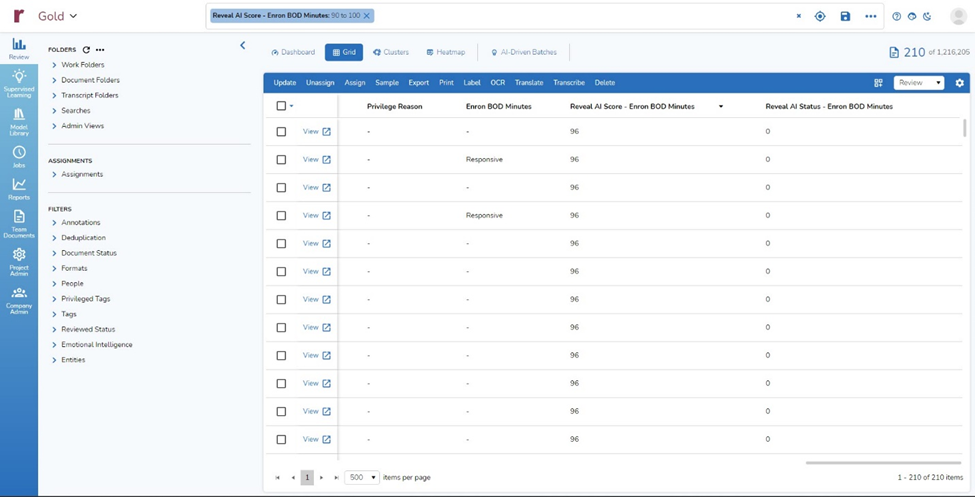
- I switched to the Grid view and scrolled right to the AI scores for my classifier. Looking at the first screen of results, I could tell that 10 of the 12 top-scored documents were ones selected by the classifier, and only two were ones that I had tagged as responsive:
I then looked at the 30 highest scoring documents to determine which met my criteria for response, and which were at the top of the list because I had tagged them as opposed to because the classifier had selected them.
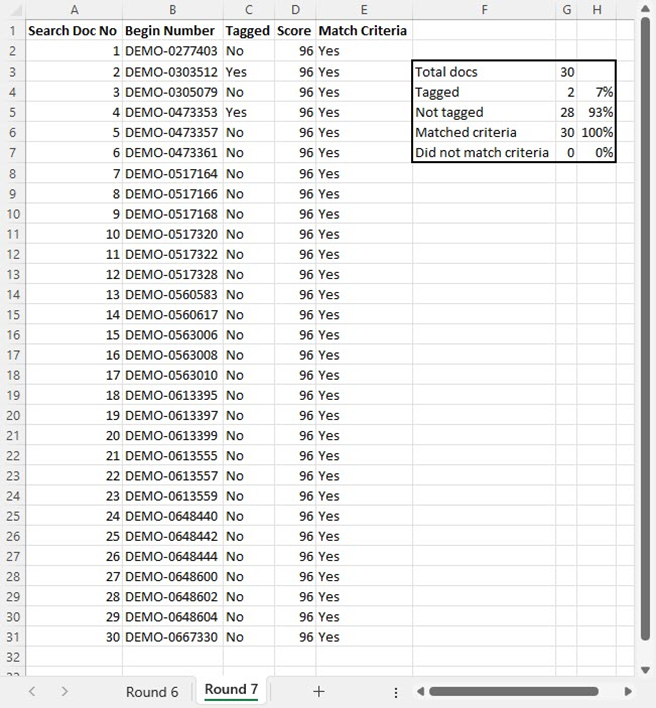
Of the top 30 documents, only two (7%) were documents I had tagged as responsive.
Twenty-eight (93%) of the documents on the list were there because the classifier had predicted, with 96% certainly, that they were responsive.
When I looked at the top 30 documents, I agreed with the classifier’s assessment every time.
The classifier has done exactly what I hoped. After spending far less time that I would have put in with a traditional approach, I had a prioritized set of documents where ones I was looking for were at the front of the queue. This approach gave me the jump start I wanted, enabling me to formulate my written responses to the other side’s discovery requests much sooner that would otherwise have been the case, in far less time, at a lower cost to the client, and with a higher degree of reliability.
Learn More
To learn more about Reveal’s AI capabilities and how Reveal can empower your organization, contact us for a demo.